PrEP Provider Toolkit
Basics of HIV
Important HIV Epidemiology
Prevalence captures the proportion of a population that currently lives with a condition. Incidence captures the proportion of a population that is newly infected with a condition.
Medical advancements such as antiretroviral therapy (ART) contribute to longer life expectancies among people living with HIV/AIDS (PLWHA) and, thus, rising prevalence rates. When it comes to PrEP, we are more concerned with incidence rates as it is a preventive tool to avoid new infections from occurring.
Figure 5 shows that the incidence of HIV in the United States has been steadily declining over the years. Despite this seemingly reassuring trend, when viewed with a closer lens, concerning disparities are revealed across racial groups, age groups, and geographic regions. HIV disproportionately affects Black/African Americans between the ages of 20-34, and a startling majority of all new HIV cases occur in Southern states alone (Figures 6-8). (5)
Centers for Disease Control and Prevention. (2021). Diagnoses of HIV infection in the United States and dependent areas, 2019. U.S. Department of Health and Human Services.
https://www.cdc.gov/hiv/pdf/library/reports/surveillance/cdc-hiv-surveillance-report-2018-updated-vol-32.pdf
It is also worth pointing out that the major reductions in HIV incidence occurred before PrEP was introduced. Improved testing and treatment of those living with HIV account for these early changes in incidence rates. This highlights the rather limited impact PrEP has had on this crucial statistic.
Since its availability, PrEP has predominantly benefited white gay and bisexual men. HIV incidence is worsening among groups of growing concern, such as Latino men and women and people who inject drugs (PWIDs) (Figure 9).
Most of the graphics shown below have been adopted from the National HIV Curriculum, a free resource created by the University of Washington and funded by the Health Resources and Services Administration (HRSA). It includes easy to follow, self-guided modules that provide an in-depth understanding of HIV: https://www.hiv.uw.edu/
They also make resources to improve your understanding of STIs, Hepatitis B, and Hepatitis C. Both CME and CNE credits can be earned by completing these self-study modules.
Click image for full size view
Click the title of the figure to view source.
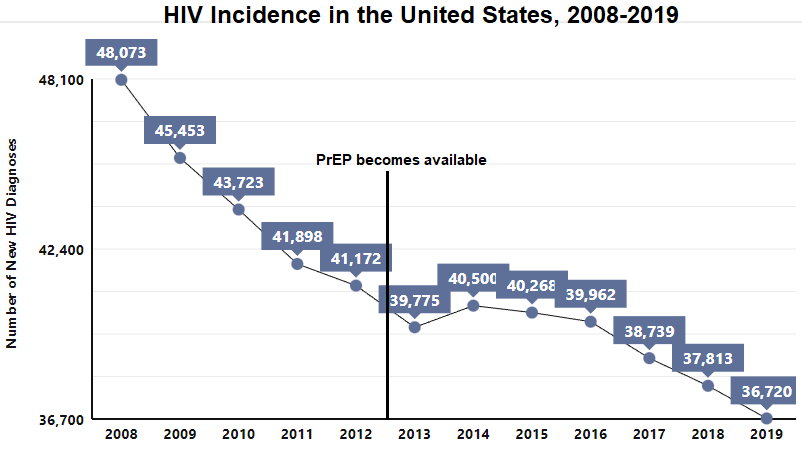
Figure 5 - Incidence Rates in the United States, 2008-2019
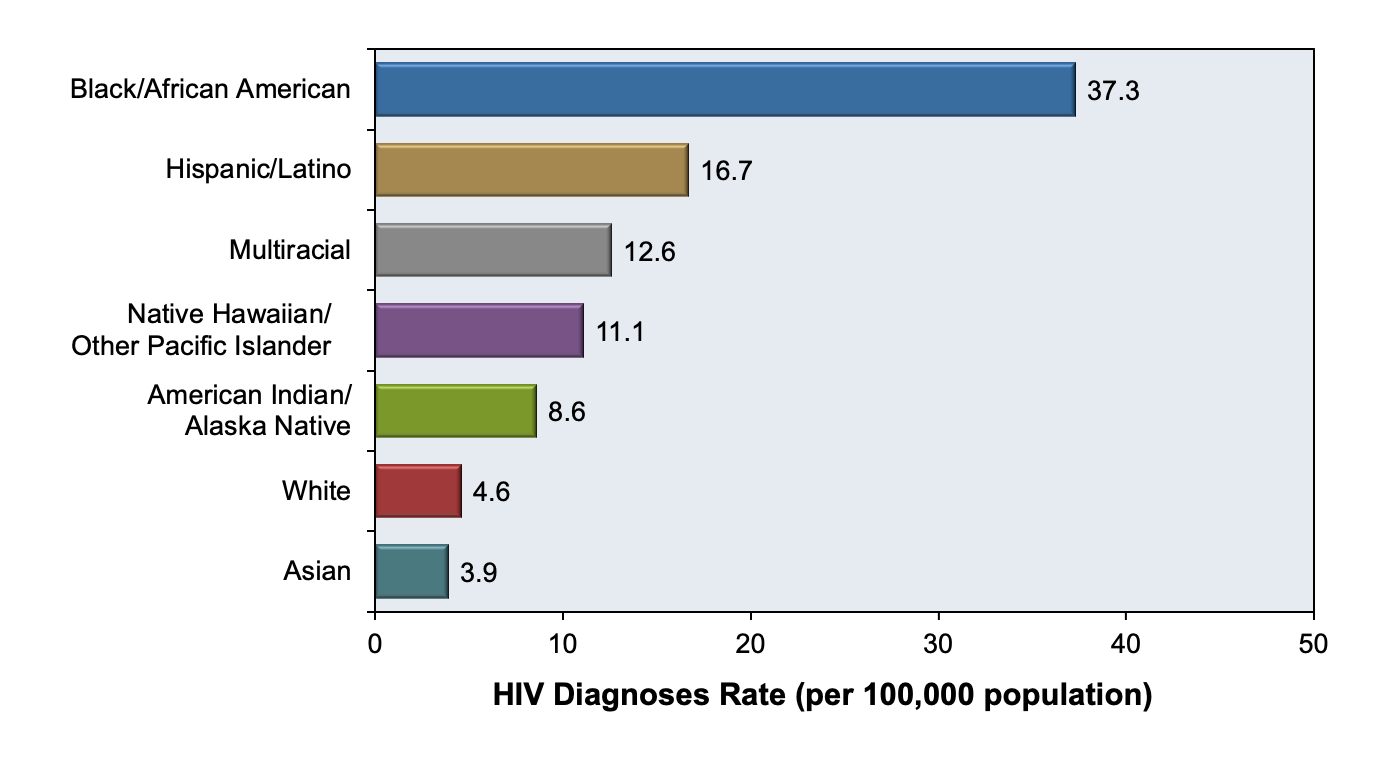
Figure 6 - Incidence Rates in the United States in 2019, by Race/Ethnicit
Source: Centers for Disease Control and Prevention. (2021). Diagnoses of HIV infection in the United States and dependent areas, 2019. U.S. Department of Health and Human Services.
https://www.cdc.gov/hiv/pdf/library/reports/surveillance/cdc-hiv-surveillance-report-2018-updated-vol-32.pdf
Graph obtained for the HIV National Curriculum at www.hiv.uw.edu. Accessed September 1, 2022.
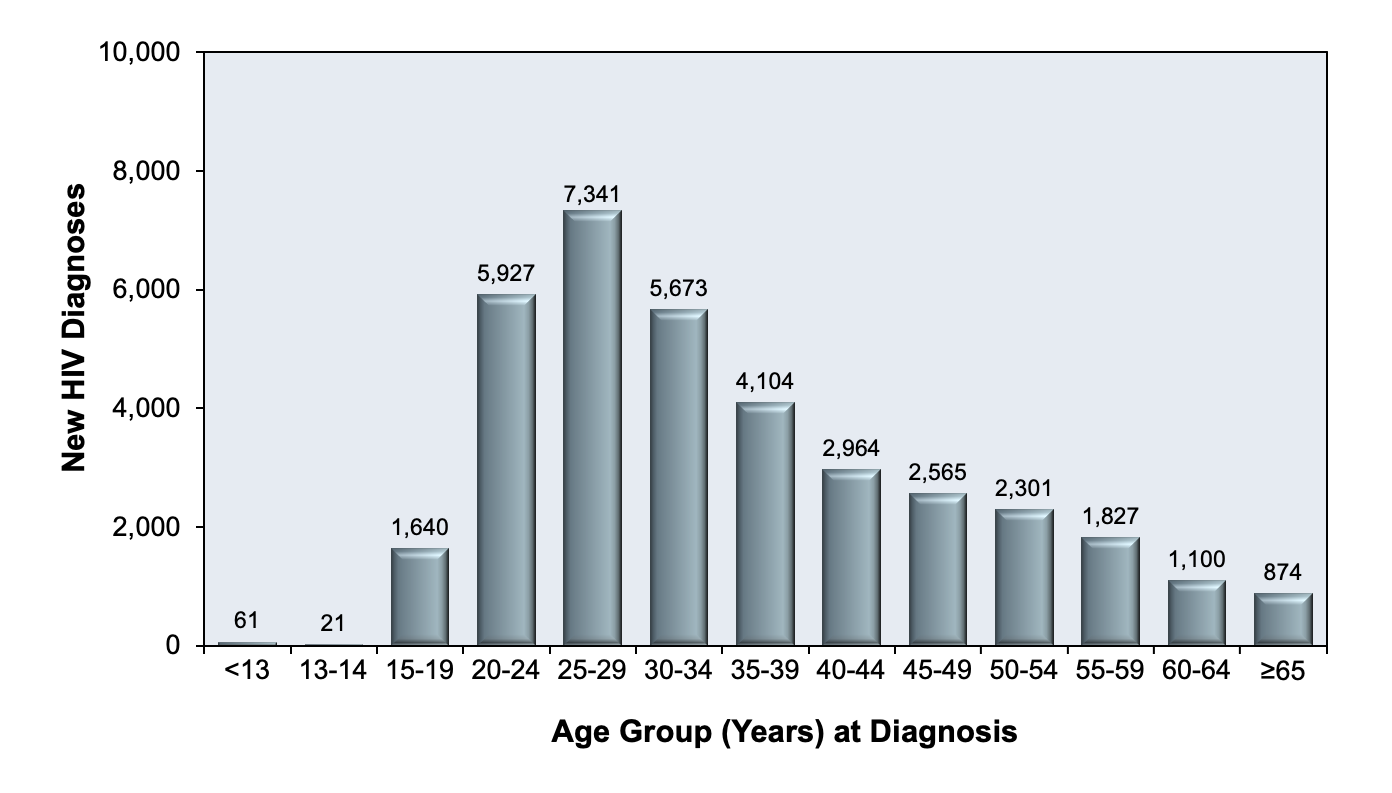
Figure 7 - HIV Incidence in the United States in 2019, by Age Group
Source: Centers for Disease Control and Prevention. (2021). Diagnoses of HIV infection in the United States and dependent areas, 2019. U.S. Department of Health and Human Services.
https://www.cdc.gov/hiv/pdf/library/reports/surveillance/cdc-hiv-surveillance-report-2018-updated-vol-32.pdf
Graph obtained for the HIV National Curriculum at www.hiv.uw.edu. Accessed September 1, 2022
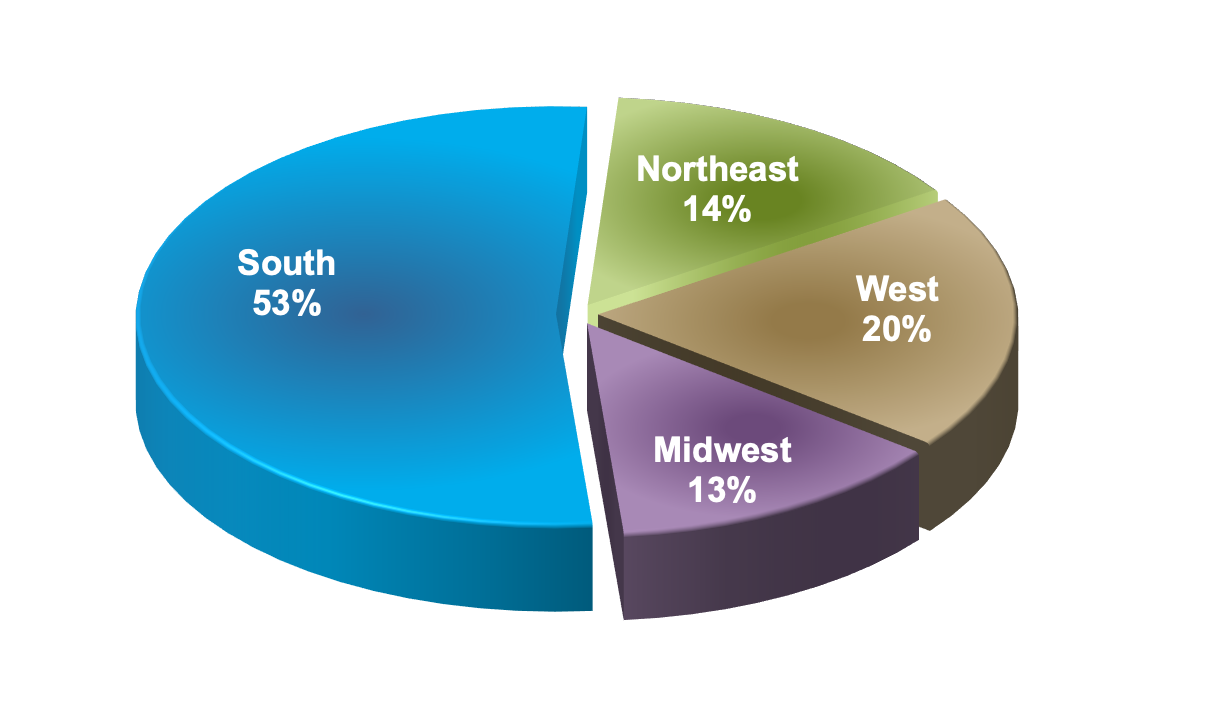
Figure 8 - New HIV Diagnosis in the United States in 2019, by Region of Residence
Source: Centers for Disease Control and Prevention. (2021). Diagnoses of HIV infection in the United States and dependent areas, 2019. U.S. Department of Health and Human Services.
https://www.cdc.gov/hiv/pdf/library/reports/surveillance/cdc-hiv-surveillance-report-2018-updated-vol-32.pdf
Graph obtained for the HIV National Curriculum at www.hiv.uw.edu. Accessed September 1, 2022.
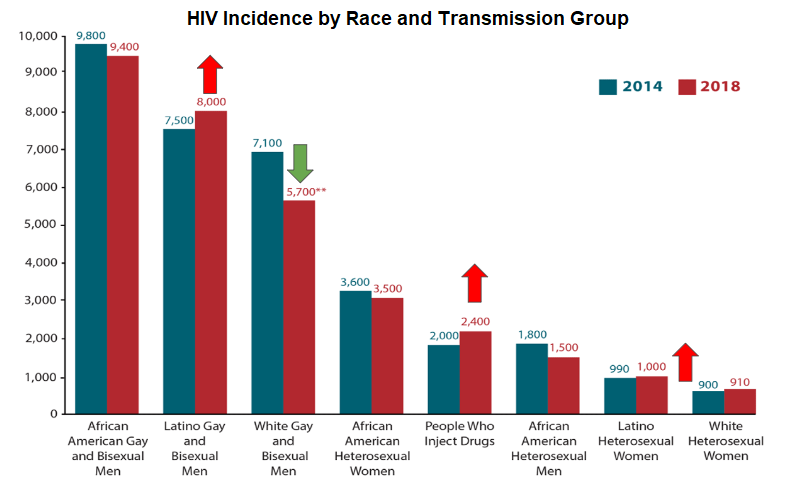
Figure 9 - New HIV Diagnosis in the United States in by Race and Transmission Group, 2014-2018
Source: Centers for Disease Control and Prevention. (2021). Diagnoses of HIV infection in the United States and dependent areas, 2019. U.S. Department of Health and Human Services. https://www.cdc.gov/hiv/pdf/library/reports/surveillance/cdc-hiv-surveillance-report-2018-updated-vol-32.pdf